Charts!
Sometimes I think half the reason I play Mahjong is to generate statitics that I can analyze and chart! Now you too can enjoy watching lines go up and to the right (I hope your lines go up?). Below I will explain in more detail what the charts are showing. You can see your own graphs here:
Example
Let’s look at an example of my own early Mahjong Soul games:

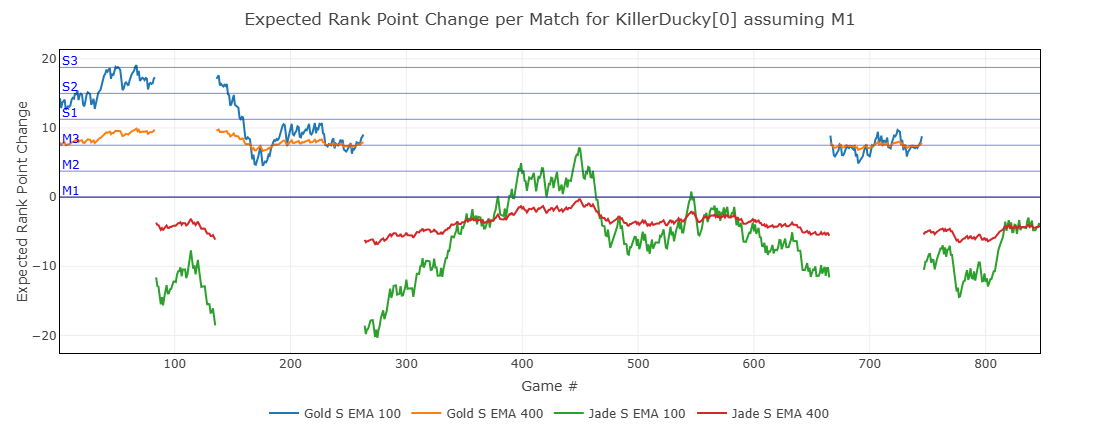
The first chart shows expected rank points gained/lost per match played. Since Gold and Jade rooms have very different player pools, those results are tracked separately:
- Blue/orange lines → Gold room
- Red/green lines → Jade room
My early Gold room results were unusually lucky, so the chart suggests that if I had continued playing in Gold room as a Master 1, I would average about +8 points per game, and eventually reach a breakeven point Master 3.
When I promoted to Master 1, I began playing all my games in Jade room. At that point Gold room trend lines stop, and the Jade room trend lines take over. (Trend lines are tied to the room you play in — if a Master plays games in the Gold room, then only the Gold room trend line updates).
In my early Jade room games, my expected points per game fluctuated around -4. The faster responding green line falls to -20 during a bad streak, followed by rising to +8 during a hot run, and so on. The slower responding lines smooth these fluctuations and give a better picture of long-term performance. The trends themselves are exponential moving averages, with half-lives of either 100 games (fast) or 400 games (slow). Because the outcome of a single mahjong game is primarily luck, it takes a surprisingly large sample of games before trends begin to reflect actual skill level. That’s the main reason I made these charts — to get an idea of my long term results.
The horizontal blue lines mark the breakeven points for different ranks. For example, if your trend line rises to the M2 line, that means you are breakeven at the Master 2 level. You can change which line is used as the y-axis 0 point by changing Norm Rank. It defaults to auto which will use your most recent rank (M1 if you are an Expert due to how the logic works, sorry Expert players!)

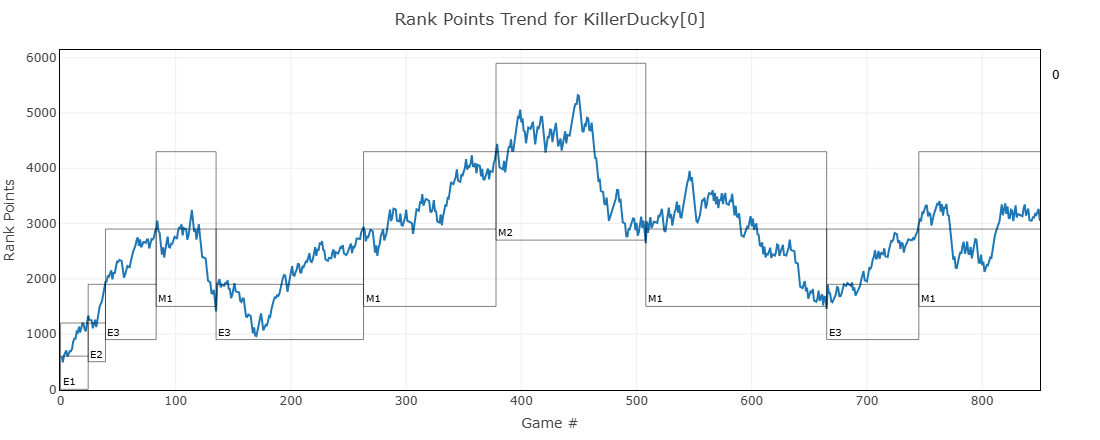
The second chart is simpler. Above you can see my early quick rise through Expert 1, E2, E3 and into Master 1. After hanging in there for awhile I had a reality check, plumetting from the midpoint in M1 with almost straight 4ths back to Expert 3.
Interactive!
Zoom out by double clicking. Zoom in with click+drag. Change the last N games to change the zoom to the end. Turn trend lines on/off by clicking in the legend.
Related links
Checkout the Random Walk simulator to get a sense of the randomness in trying to climb the MJS ladder.
Credits
Rank chart based on Original collab script (In Japanese)
All data from amae-koromo – check it out for more stats!